I can nearly guarantee your early or growth-stage B2B startup doesn’t have the right marketing analytics in place to determine what’s actually working across go-to-market.
Startups either don’t know how to set up the right basic tracking and data collectioncor they over-engineer something way too complex for their stage. Both scenarios result in not having the right marketing data to operate efficiently. With the complexities of go-to-market motions, funnel mapping, and tooling, I understand why this is the case—but it’s definitely something you need to fix! Every marketer should know if the activities they are focusing on are actually driving revenue.
When reporting is inaccurate, not trusted, or incomplete, not only do you not know what’s working in marketing, but this scenario also causes confusion and tension across GTM teams. Attribution disagreements between marketing and sales are really commonplace—and if you’ve ever “argued” about attribution you know how frustrating it can be. Something that should be pretty objective (measuring what’s working), is actually one of the most subjective areas of marketing. And every marketing, growth, sales, and ops leader has a different recommendation on how to measure success and what tools to use. I’m here to try to make this all a little easier.
This newsletter intends to make reporting, attribution, and forecasting less scary and give you a concrete understanding of the must haves for B2B marketing analytics at early and growth stages. I probably won’t be able to settle all of the attribution debates, but I can help you get the basic foundation in place so you know what marketing efforts to stop, start, and double down on—and how to forecast for the future.
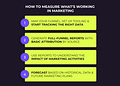
I’ll cover…
- How to map your funnel, set up tooling & start tracking the right data
- How to generate full-funnel reports with basic attribution based on the source
- How to use reports to understand the impact of marketing activities
- Why you need a bottoms-up forecast
Thanks to our (highly-curated) sponsors
We only include sponsorships from products or services when we’ve received a positive recommendation from the MKT1 community or our portfolio companies—or when we’ve used the product or service ourselves.
42 Agency – Demand Gen & RevOps
From 42 Agency: We’re a trusted growth partner for B2B SaaS companies—including startups in the MKT1 Capital portfolio. Our agency helps startups with Demand Generation & RevOps to hit aggressive pipeline targets.
Why we recommend 42 Agency: If you want to implement anything we wrote about in this newsletter, reach out to 42 Agency. In fact, they contributed to and reviewed this newsletter for me—thanks Kamil & team! They’ll be true partners and a pleasure to work with.
Sendoso
From Sendoso: Sendoso is a Sending Management Platform that optimizes your existing channel strategy with meaningful, well-timed direct mail touchpoints. Use us as a pipeline accelerator to: engage buying committees, improve demo and event attendance rates, boost email open/response rates, and amplify field marketing efforts.
Why MKT1 recommends Sendoso: We sent direct mail to MKT1 Capital LPs a few months ago and it took about 10x the amount of time it should have. Afterwards, we both actually said, “Why didn’t we just use Sendoso?”They make direct mail and managing swag/merch so much easier, it’s a no-brainer.
Another pro-tip: Don’t try to send customized matchbooks in the mail like we did.
RevenueHero
From Revenue Hero: RevenueHero is the easiest way for marketers to qualify and route leads to a sales rep’s calendar, right in your demo request flow and in email sequence. Marketers love RevenueHero’s built in routing logs, native integrations with the GTM stack, ease of branding, and insights at every step of the conversion funnel.
Why we recommend RevenueHero: When you look at conversion rates in your full-funnel reports, you’ll probably notice there’s room to optimize your demo request form. RevenueHero makes this easy. We discovered more about what they’re building at RevenueHero while doing research our last newsletter and heard all great things.
MKT1 Discount: Mention MKT1 for 15% off if your purchase through the end of September.
How to set up basic funnel tracking
I ask early and growth stage startup marketing leaders in my Building B2B Marketing Course if they can track their funnel from form fill through to revenue, and 50%+ say no.
This may seem surprising as full-funnel reporting is so essential—you can’t tell what’s working in marketing or forecast revenue effectively unless you do this. But, trust me when I say that making this happen is not obvious or easy for lots of early-stage startups. So, I’m going to walk you through it (but skip this section if you know this stuff).

Here are the steps to get from zero marketing analytics to full-funnel reporting:
- Identify your funnel stages: You need to know the goal posts along the lead to customer journey. Yes, many leads won’t follow a linear path, but even if they move in loops or zig zags throughout the journey, there are still milestones. These milestones or goal posts are your funnel stages. I wrote a whole newsletter on mapping your funnel here.
- Set up these stages in your CRM and marketing automation tools. Be sure all prospects pass through all funnel stages. Note: Often times prospected or outbound leads skip the “marketing qualified” stage and this creates reporting madness. Don’t set things up this way. More on this later.
- Set up Google Analytics tracking on your website. And also set up Google Search Console while you’re at it.
- Use a marketing automation tool, I recommend Hubspot. This will be the source of truth for marketing interactions and will 2-way sync with your CRM (whether that’s Hubspot or Salesforce or something else).
- Connect your conversion forms to your marketing automation tool: The easiest way to do this is to just use Hubspot forms—so when someone fills in info it automatically gets tracked in your marketing automation tool and CRM. But if you are using something else for forms for some reason, you can feed the data into your marketing automation tool easily through integrations.
- Use UTM codes and make sure that data is getting passed through your forms into your marketing automation tool. This doesn’t happen automatically with Hubspot (even though it really should), but setting this up only requires a bit of work. Having UTM code data mapped to funnel data is a huge unlock for understanding top of funnel. See the next section for more details.
- Track conversion events & campaigns: Set up conversion events in Google Analytics and Campaigns in Salesforce (or your CRM) to track more activities on your website and throughout your marketing funnel.
- (Optional) Augment your CRM data using lead enrichment tools. More on that in our funnel mapping newsletter.
How to pass UTMs through your forms
Adding UTM codes aka parameters to all links to your website helps you collect first-party data on how your leads got to your website and enables you to get more precise than the basic data provided to you out of the box in Google Analytics or Hubspot web analytics. We’ve all seen this, and it looks like this link Sendoso sent us to track their sponsorship of this newsletter:
https://sendoso.com/solutions/marketing-leaders/?utm_source=MKT1&utm_medium=email&utm_campaign=2023-09-01-PROS-3RDMEDIA-MKT1Most marketers know to use UTMs, but many skip the next step—which is the key to basic attribution. As I mentioned, you need to make sure your UTM code data and your form data stick together. To do this, you’ll create hidden fields in your form and pass the UTM parameters through your form. Here’s how to do th is in Hubspot.
Basic full-funnel reporting
We’ve covered how to get things set up and after the data rolls in you should be able to produce reports that give you basic full-funnel analytics.
Here’s what that report might look like when exported to a spreadsheet:
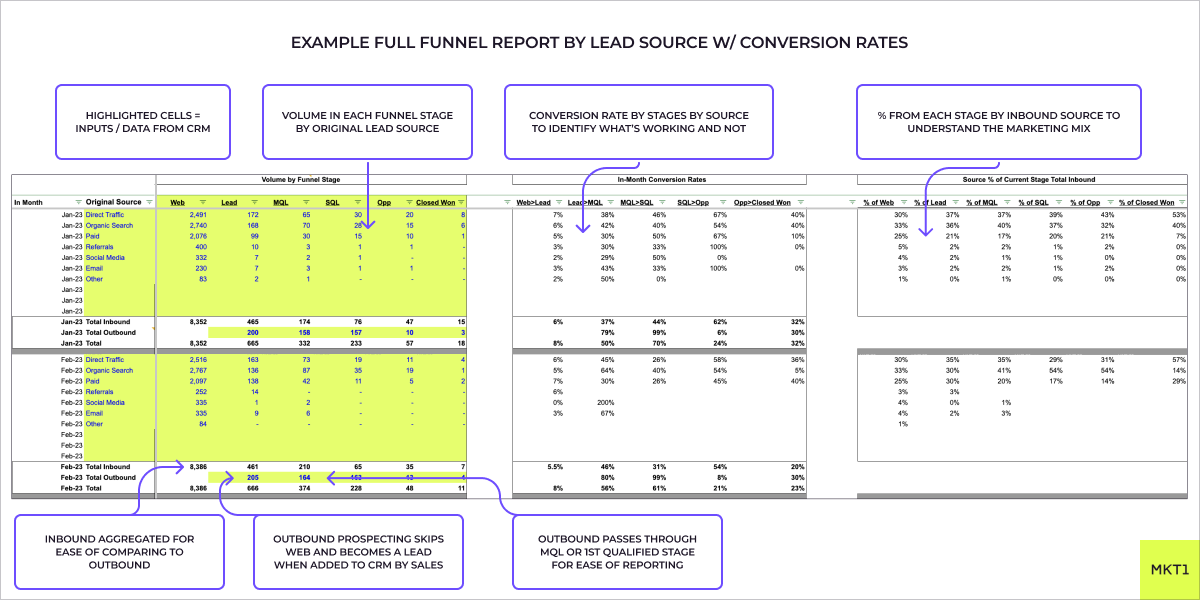
A few things to note about this example report:
First, see the comments on the screenshot above. But here are some more details:
Inbound vs outbound sources
If you don’t look at inbound and outbound separately, your conversion rates will look confusing. You need to break this out and recognize that the way these leads move through the funnel is a bit different. Inbound sources should be further broken out by specific channels (you can use the standard classifications from GA or Hubspot and/or use your UTM source codes).
I’m using outbound to mean leads that were originally prospected and emailed by sales (before they came inbound), this shows up as “offline” in Hubspot. Inbound sources typically include email campaigns, organic search, paid ads (SEM, display ads, social ads), referrals from other sites, organic social, and direct traffic.
This example funnel report is by original lead source or “first touch”
The above report gives you a linear view of the lead to customer journey broken down by how a lead got to your website before they filled out an inbound form. But obviously, that’s not always how leads get to you and this report in isolation doesn’t give you all the information you need to know what’s working.
That said, early on, you don’t need a complex multi-touch attribution model to figure out what’s actually going on. In fact, that would be distracting and likely overkill at your stage. But figuring out what’s working is also not as easy as just looking at the original source of a lead (aka how they first got into your database), even if that’s the primary way you slice and dice your funnel and create reports. I recommend you also look at the last touch at the qualified stage (aka the qualifying event) and campaign influence reports, more on this below.
In addition to full-funnel reports based on first touch, last touch, and campaign influence, here are some other reports that are helpful to get a full picture of what’s going on in marketing:
- Cohorted and in-month funnel reports
- Full-funnel reports broken out by individual paid campaign, especially as your paid budget increases
- Web activity and conversion by page
Workshop + Full-funnel report template
For a complete full-funnel report template and guidance on using these reports, join our workshop on 10/5 co-hosted by Recalc Academy, who specialize in Spreadsheet and finance training. This event is free for paid subscribers and $50 for non-paid subscribers (so we can make sure everyone is engaged and committed to learning during the session).
How to look at what’s working, aka basic “attribution”
To figure out what’s working, you need to attribute revenue to marketing activities. There are a handful of ways to do this. Here are the most common:
- Mutli-touch attribution models recognize that many touch points contribute to revenue. For multi-touch attribution, a model is created that applies different percentages or amounts of credit to different marketing activities. These models are typically overly complex for early-stage startups. Multi-touch attribution typically requires purpose-built attribution software like Bizible, which only makes sense when startups scale and begin to spend lots and lots of money on paid.
- First-touch attribution is a type of “single-touch” attribution that “credits” the initial touchpoint with driving revenue. First-touch can look at the first visit to the website or original source of an email address. I prefer to look at the latter for attribution purposes, although looking at web traffic sources that don’t convert is also valuable.
- Last-touch attribution is a type of “single-touch” attribution that credits revenue to the activity that happens just before an opportunity or deal is created. If you only use this methodology, you assume that the final interaction before the conversion is the most influential.
- “Campaign influence” means looking at the impact of certain activities or “campaigns” on revenue. “Campaign influence” is what Salesforce calls these reports, so most people just use that lingo. Campaigns can be events, ad campaigns, gated content, etc. Looking at campaign influence shows you which “campaigns” touched a closed won account throughout the lifeycle. Looking at campaign influence, and even assigning values to different campaigns in Salesforce, is a lightweight version of multi-touch attribution.
Note: Adding up all of the campaign influenced revenue will total more than 100% of revenue; it’s not mutually exclusive and assumes multiple campaigns influenced revenue.

Don’t pick one attribution method—look holistically at what’s working
IMO, basic attribution is not an either/or situation nor does it require building a complex multi-touch attribution model with different percentages applied to different events early on.
To know what’s working and what to do in the future in marketing (aka attribution) you need to look at a handful of funnel reports (see the diagram above). You need to understand the way a lead got into your database/CRM, what happened just before they became qualified, and the impact of all of your campaigns or activities on revenue.
In other words, you need to apply different lenses to your marketing reporting. You may look at one report or view of the data more often than others, but you shouldn’t ignore the two other ways to look at basic attribution. Using a combination of reports, won’t give you a single answer on “what works best”, but definitive answers provide false signals when it comes to attribution.
Basic attribution step by step
- Look at full-funnel conversion: Understand conversion rates (and time) between each funnel stage.
- Look at full-funnel conversion by source: Slice and dice your full-funnel conversion report by “first touch”, or the original source of the lead. Create a second similar report that slices and dices this data by “last touch” at qualified.
- Define “first touch” as the source of the lead or email address—how did it get into your CRM? You can bucket inbound and outbound separately, and then look more granularly at the source of your inbound leads. This method really falls short if you are doing a lot of prospecting and outbound (more on that in the next section).
- Define what “last touch” means & report on it. This is a little more complicated because people have different opinions on when the “last touch” occurs. I recommend using the last touch before a lead becomes “marketing” qualified, I often call this the “qualifying event”. Note: Setting this up requires some custom set up in Hubspot to “stamp” this activity at this stage. Out of the box you only get the most recent activity, which is not the same thing.
- I prefer to call the “marketing qualified” or “MQL” stage “Qualified 1” or “Q1”
- “Marketing qualified” is a misnomer. This stage is just an automated qualification stage. Even if marketing activities never touched the lead and sales prospected and sent a cold outbound email to a lead, it still needs to pass through this stage.
- The “sales qualified” or SQL stage is also a bit of a misnomer. I prefer to call this stage “Qualified 2” or “Q2”. This stage is just a manual qualification that a lead actually meets segmentation criteria.
- Look at reports that show “campaign influence” on revenue for all major marketing activities/initiatives/campaigns. Once you set up “campaigns”, this reporting is out of the box within Salesforce and Hubspot.

A quick note on “in-month” vs. “cohort” reporting:
Most basic marketing funnel reports show you how many people got to each stage in each month. Meaning, if someone fills out a form in January and buys in March, they will show up as a lead in January and a closed won deal in March. This means that the conversion rates between stages can be a bit misleading (because sales cycles usually last more than a day!). These “in-month” reports don’t show you what happened to all leads who came through your form in January. To look at that you need to use a report grouped by cohort (where the cohort is based on when a lead was qualified). To set this up in Hubspot use Lifecycle Stage date stamps. When you use cohort reports, note that the data will change retroactively as leads hit stages further along in the funnel.
Cohort reports give you another lens on your data and what’s driving revenue and I recommend looking at these in addition to in-month full-funnel reports.
What to watch out for when doing basic attribution:
- Prospecting, outbounding, and lead lists can mess with inbound and first-touch attribution: If you do a lot of prospecting or list building/buying and then simply look at how a lead got into your CRM, it will look like all of your revenue came from prospecting. Even if the lead never opened an email and later came inbound and converted it will still look like they came through prospecting (not marketing/inbound) in a first-touch/original lead source report. Marketing efforts will be undercounted. In these situations, it’s especially important to look at “last touch at qualified”, meaning look at what happened before a lead moved to the first qualification stage. In this example, that will show that the lead came inbound just before qualifying, which gives you a more complete picture.
- Determining sales commission and attribution is not the same process. Figuring out attribution for commission purposes usually means looking at a singular data point (like first touch or last touch), but this shouldn’t be all you look at to get the full story of what’s working across GTM. Attribution isn’t usually that simple. Make sure your compensation model isn’t your only view on attribution and therefore misguiding your entire business. To me, it’s not the end of the world if you slightly overpay sales reps due to over-attribution in the commission criteria, as long as you still realize that other factors are contributing to revenue.
- All leads, including prospected leads outbound by sales, must pass through all funnel stages in your systems or your funnel reports will be messy. Specifically, prospected leads that sales outbounds to need to pass through the “MQL ” or “Q1” stage (even if for a literal second) before they get to “SQL” or “Q2” stage for clean funnel reporting. In this case you mark the last touch at MQL/Q1 (aka qualifying event) as “Outbound”. This is why calling this stage “Q1” not “MQL” is a more accurate naming convention.
To summarize how to think about basic attribution…
Basic attribution means looking at full-funnel conversion from web visit to lead to revenue, and slicing and dicing your funnel data in different ways to get a full picture—which means looking at first touch, last touch, and campaign influence reports.
Use this data to create bottom-up forecasting in a spreadsheet
Often marketers (and sales) get a top-down, high-level revenue target they must hit for the year or quarter from founders and execs. Top-down forecasting is really valuable as it represents what’s necessary to say on the desired growth trajectory. But, often marketers are left wondering if that number is even feasible. The best way to figure out if the top-down forecast is possible is to forecast in the opposite direction—from leads all the way to revenue. This method is called bottom-up forecasting (I have to google every time if it’s “bottom” or “bottoms up” even though I know bottoms up means “cheers”. Am I alone here?)

Bottom-up forecasting is impossible if you don’t have a full-funnel report with multiple months of data by source and conversion rates between stages. Once you have a full-funnel report like the example way up at the top of the newsletter, it becomes much easier:
- Use your historical full-funnel data
- Add in assumptions for web traffic growth, outbound prospecting growth, conversion rate improvements, seasonality, impact of upcoming marketing activities, and even increases in average contract value.
- This helps figure out where you might land a quarter or a year from now. Note: If you have a really long-sales cycle, you’ll want to make sure to use cohort reports for forecasting.
Forecasting pretty much always happens in a spreadsheet, especially in the first few years of a startup’s life. This is totally fine. Even with all the tools available today, most marketing teams still fall back to a spreadsheet when it comes to marketing reporting and forecasting. Some companies successfully get all of their data into a BI tool and even more companies get most of their reports built out in their CRM, but almost all have some version of the big marketing spreadsheet report. Early on you really don’t need a complex BI tool that marketers don’t know how to build reports in.
For a deep dive into forecasting, join my workshop co-hosted by Recalc Academy, who specialize in Spreadsheet training on 10/5. We’ll show you how to use your marketing funnel data in a spreadsheet to forecast and plan—perfect for thinking about 2024 planning. $50.
Paid subscribers: Check the latest paid post for the promo code to take our on 10/5 for free.
Conclusion: Get basic reporting in place so you actually know what’s working
The ultimate goal of marketing reporting and attribution is to see what’s working (and not working). Knowing what’s working has lots of downstream implications on things like budgets, sales commissions, headcount, etc. But, most startups do attribution wrong, or don’t do it at all.
It’s critical—especially right now as startups try to get more efficient—to look at what’s happening in your funnel and what’s driving revenue. If you don’t do this, you’ll do the wrong things (like hire a million SDRs and fire your whole marketing team—sorry I had to throw that in). Run, don’t walk to get basic reporting set up in place—but be careful not to boil the ocean or over-engineer your system.
If you regularly look at full-funnel reports by original source of the lead and by last touch at the qualified stage PLUS reports that show the influence of individual campaigns on revenue you’re doing it right!